Observability Your Engineer Actually Uses

Laptop-native observability for LLMs, microservices, and APIs. Zero-config setup. Privacy-first. Offline-capable. Ship with confidence.

macOS, Linux, Windows. 5-minute setup. No signup required.

DevScope dashboard on MacBook Pro showing LLM trace with cost and latency metrics, microservice topology map, and local API request monitoring

Your Dev Environment Is a Black Box

You ship to staging. Then you find out what broke. Sound familiar?

You Are Debugging Blind

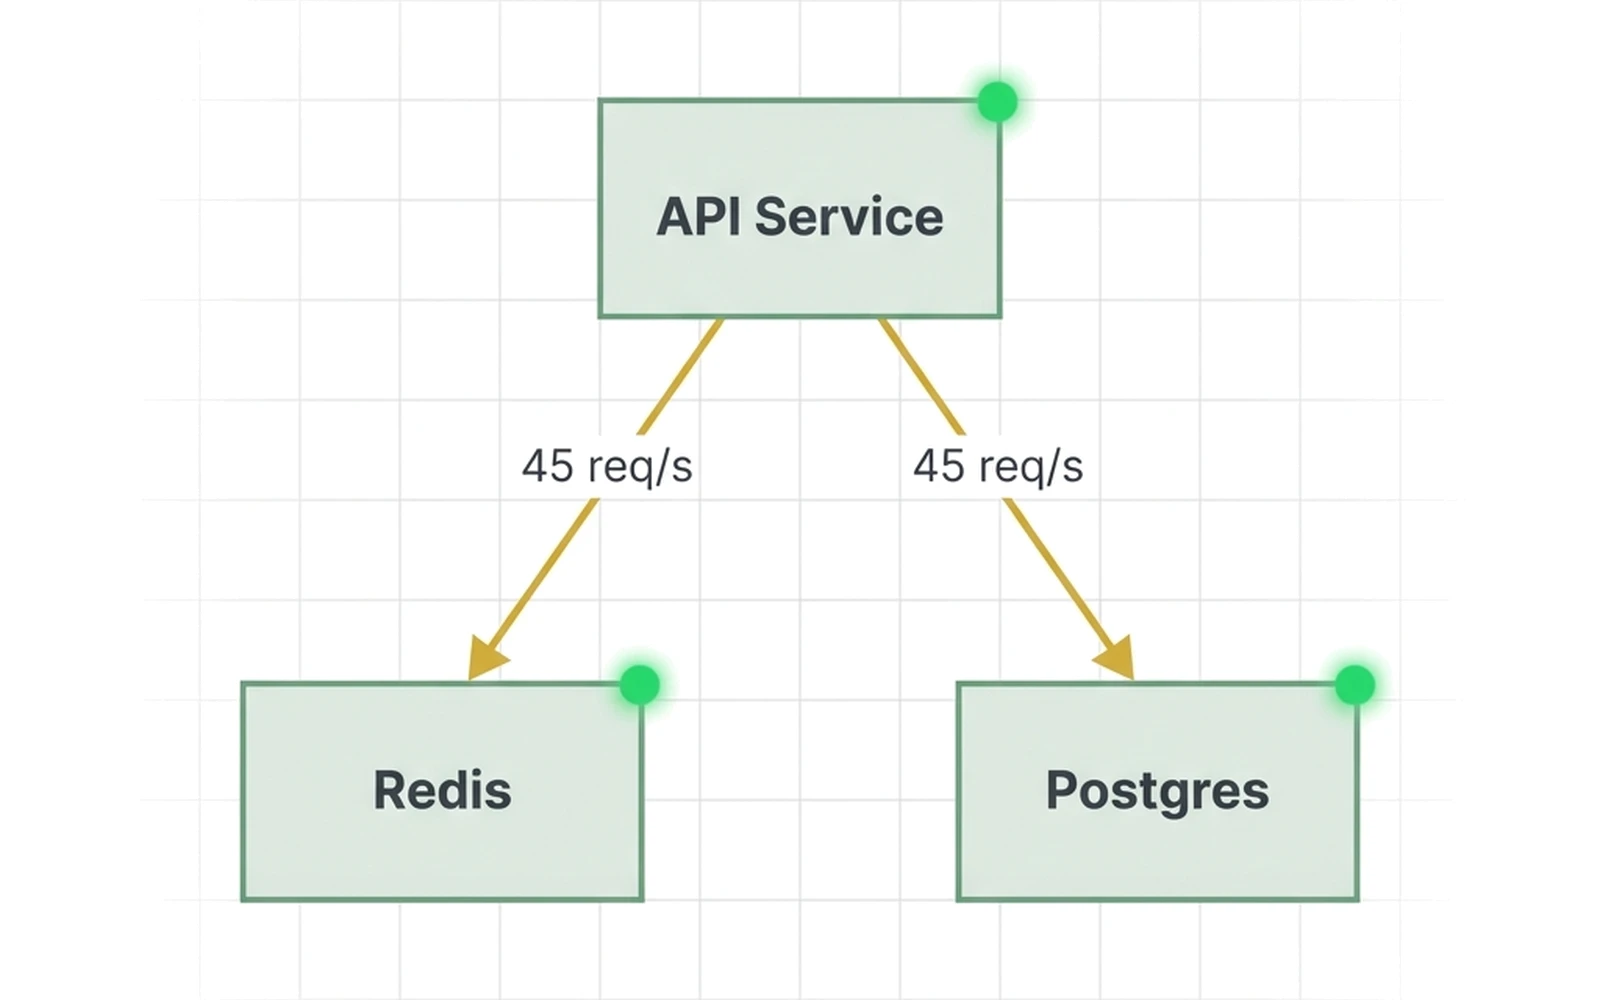
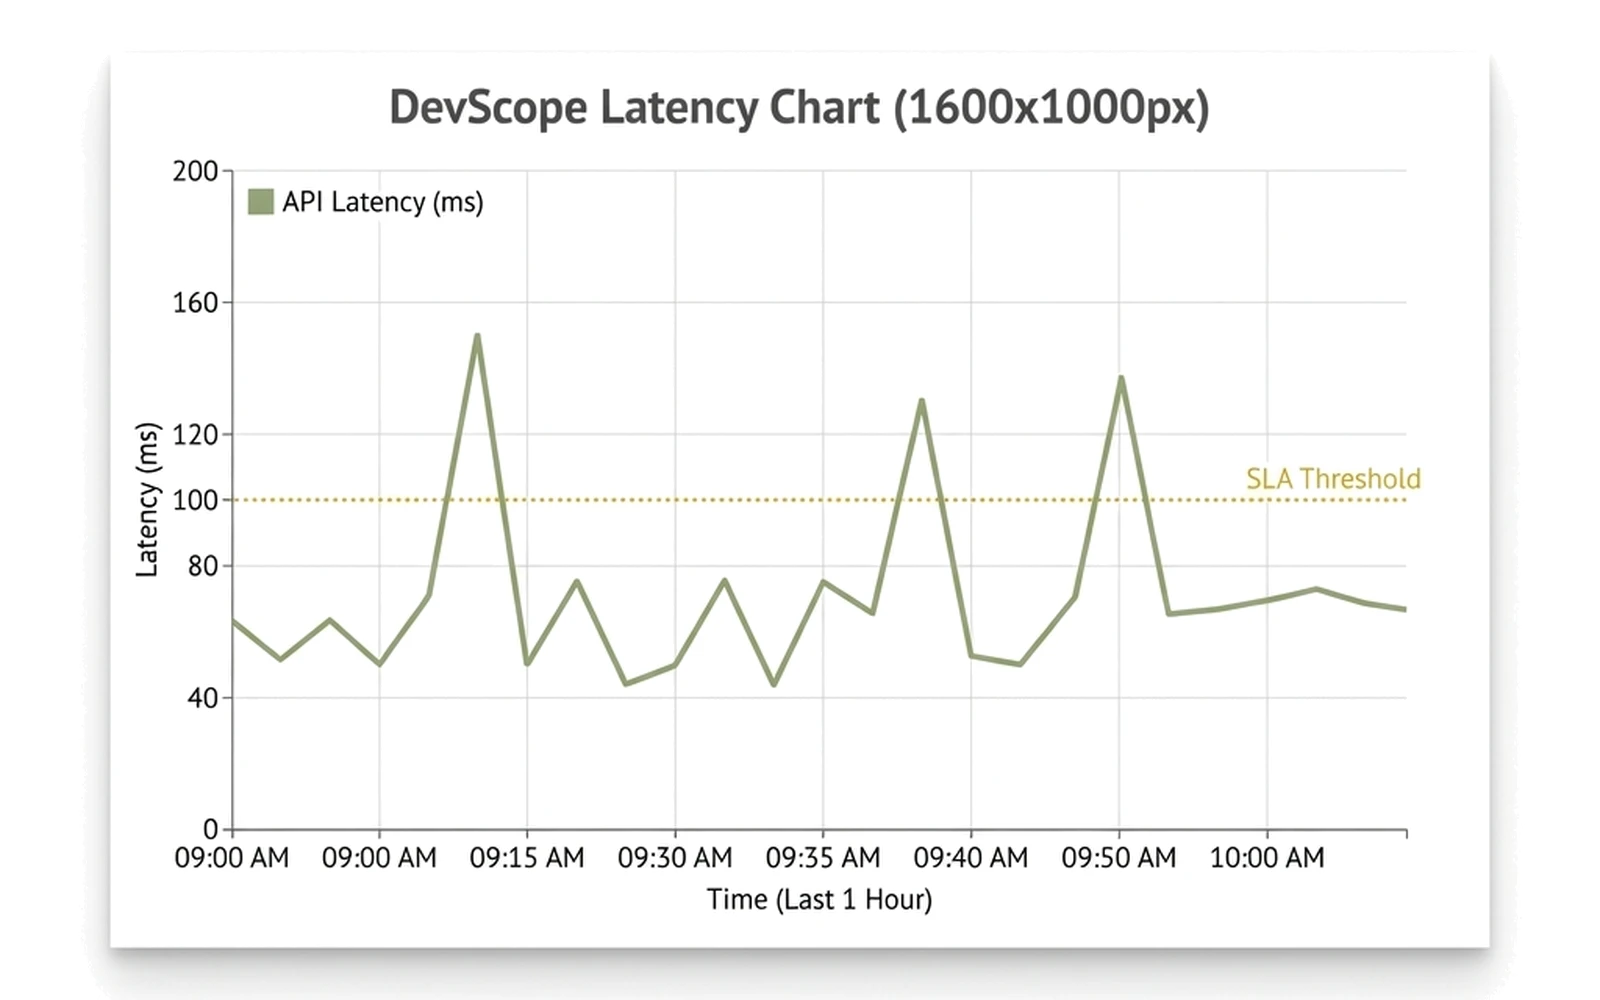
You cannot observe LLM calls, microservices, or API requests locally. “Works on my machine” is a guess, not a fact. Your local dev environment gives you zero visibility into what your code actually does at runtime.

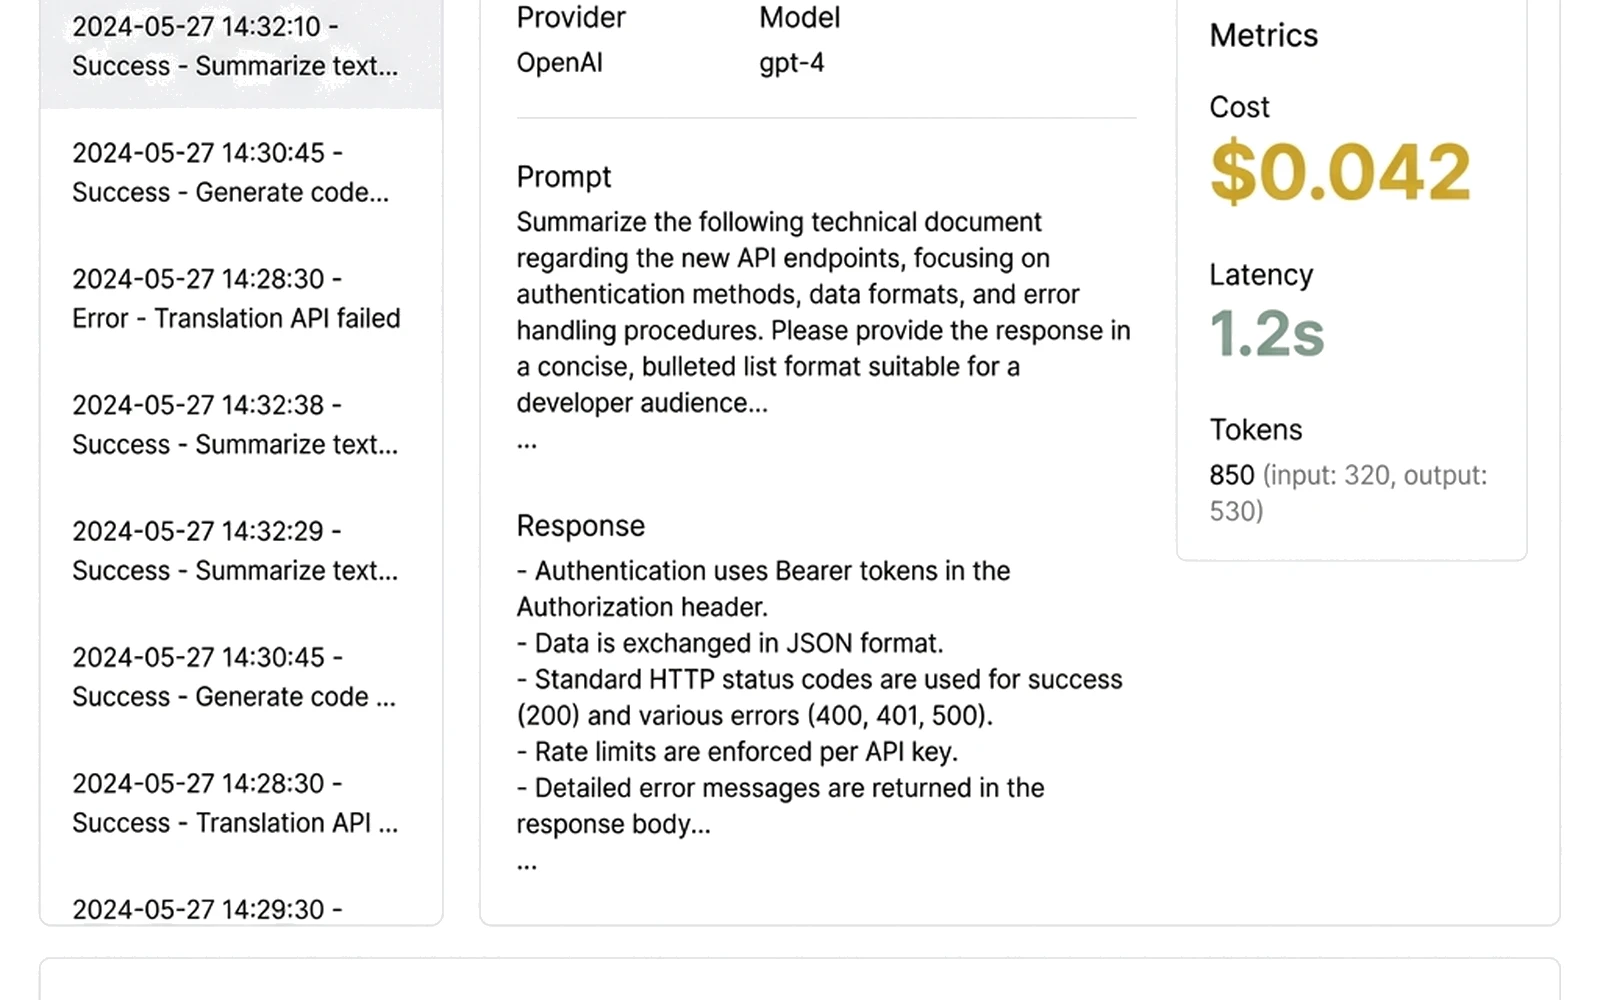
“I can’t see what my LLM calls are doing until I ship to staging.”

See how DevScope solves this

Your Dev Loop Takes 30+ Minutes

Deploy to staging. Wait. Check logs. Find the issue. Fix it. Redeploy. That is your feedback loop — 30+ minutes for a 2-line change. You are spending more time waiting than building.

“I spend 20 minutes deploying to staging just to test a 2-line change.”

See 5-minute setup

Compliance Says No

Cloud-based APM sends your telemetry offsite. Your LLM traces include sensitive prompts, customer data, PII. Compliance blocked your observability tool request. You are stuck without visibility because your current options cannot stay local.

“Privacy matters — I don’t want my LLM prompts sent to third-party APM vendors.”

See privacy architecture

Four Features. Zero Friction.

Local observability that does not slow you down.

Privacy-First Architecture

What It Does

All traces stay on your laptop. No cloud calls. No third-party APIs. No data exfiltration. DevScope runs a local collector and dashboard — your telemetry never touches an external server.

Why It Matters

Compliance-friendly for sensitive workloads. Your LLM prompts, customer data, and PII stay where they belong — on your machine. No vendor access. No audit headaches.

“Monitor LLM calls to Claude and GPT without sending traces to third-party APM. Compliance approved it in one day.”

Lightweight. Under 50ms Overhead.

What It Does

Async instrumentation adds less than 50ms to your request lifecycle. DevScope hooks into your framework at the middleware layer and collects traces without blocking your application threads.

Why It Matters

Your dev loop stays fast. No perceptible slowdown. No “observability tax” on local performance. You get visibility without sacrificing the speed you depend on.

“Add observability to a local Flask API without adding 200ms to every request. Most developers do not notice any slowdown.”

Instant Setup. 5 Minutes.

What It Does

Install via CLI. DevScope auto-instruments Flask, FastAPI, Django, Express, Next.js, and more. Zero configuration required. No YAML files. No environment variables. No code changes.

Why It Matters

You get value in 5 minutes, not 5 hours. Install, run your app, and see traces. That is the entire setup. No day-long configuration rituals. No documentation deep-dives before first value.

“Install DevScope, run your app, see traces — all in 5 minutes. Zero config. No code changes.”

LLMs. Microservices. APIs. All Visible.

What It Does

Observe OpenAI, Anthropic, and Ollama calls. Trace Docker containers, local APIs, Redis, Postgres. See the full request path — from your API gateway through your LLM provider and back — all on localhost.

Why It Matters

Modern dev stacks are not just HTTP requests. You are building with LLMs, running microservices in Docker, querying multiple databases. DevScope sees all of it. Not just the web layer.

“See LLM prompt, retrieval, response flow for local RAG development. Track cost per call, latency per provider, tokens per request.”

Install. Run. Observe.

Zero-config default. Auto-instrumentation. Offline-capable. Total time: 5 minutes.

1 MINUTE

Install DevScope

One command. All platforms. DevScope installs a local collector, dashboard server, and auto-instrumentation hooks. No dependencies. No Docker required for the tool itself.

curl -sSL https://devscope.sh/install.sh | bash

Supports macOS (ARM + Intel), Linux (x86_64, ARM64), Windows (WSL2).

2 MINUTES

Run Your App. No Code Changes.

Start your application as usual. DevScope auto-instruments Flask, FastAPI, Django, Express, Next.js, OpenAI SDK, Anthropic SDK, LangChain, Redis, and Postgres. No decorators. No middleware registration. No config files.

devscope run -- python app.py

Auto-instruments 15+ frameworks. Manual instrumentation available via OpenTelemetry SDK for unsupported stacks.

See Supported Frameworks
2 MINUTES

Open Your Dashboard. See Everything.

Navigate to localhost:7878 in your browser. See traces, metrics, and service topology. Filter by LLM calls, API requests, database queries. Drill into individual spans. View cost, latency, and token usage for every LLM call.

open http://localhost:7878

Dashboard runs locally. No internet required. No cloud login. Works offline.

Download Free

See DevScope in Action

Real dashboard. Real traces. Real developer productivity.

DevScope dashboard showing detailed LLM trace with OpenAI API request, cost analysis, latency metrics, and token usage
See exactly what your LLM calls cost. Track prompt tokens, completion tokens, latency, and spend — per call, per provider, per session. Optimize prompts before they hit production.
DevScope topology map showing local Docker containers with API, Redis, and Postgres services connected by request flow arrows
Understand service dependencies at a glance. See which container talks to which. Identify bottlenecks in your local microservice stack without deploying to a dev cluster.
DevScope latency chart showing API request response times over local development session with performance trend analysis
Identify performance regressions before you commit. Track latency trends across your local dev session. Catch slow queries, degraded endpoints, and LLM latency spikes in real time.

Built by Developers. For Developers.

Join 5K+ engineers shipping with confidence.

“DevScope cut my local dev feedback loop from 20 minutes to 2 minutes. I see LLM calls, API latency, DB queries — all without leaving my laptop. I do not know how I built without this.”
Sarah Kim, Principal Engineer
Sarah Kim, Principal Engineer SaaS Company (200-person engineering team)
“Privacy-first observability was non-negotiable for us. DevScope runs locally, zero data exfiltration. Compliance approved it in one day. That never happens with observability tools.”
Marcus Chen, Staff Engineer
Marcus Chen, Staff Engineer FinTech Startup (50-person engineering team)
“My team adopted DevScope in one sprint. Zero-config setup. Works with our stack — FastAPI, Redis, Postgres, OpenAI. Now every engineer observes their code before merging. Release confidence went through the roof.”
Priya Sharma, Engineering Manager
Priya Sharma, Engineering Manager E-commerce Platform (30-person engineering team)

Open-Source. Community-Driven.

MIT License. 5K+ downloads. 100+ GitHub stars. Built in public.

100+
Stars. Starred by engineers who read the code before they trust the marketing.
View on GitHub
5K+
Downloads. macOS, Linux, Windows. Trusted by engineers globally.
Download DevScope
50+
Contributors. Report bugs. Submit PRs. Shape the roadmap. Build with us.
Contributing Guide
MIT
License. Free. Forever. No vendor lock-in. No subscription trap.
View License
View on GitHub

Star the repo. Fork it. Contribute. The code is the proof.

Scale to Teams When You Are Ready

Team dashboards. Persistent storage. 24/7 support. Start free. Upgrade when your team needs it.

Team Dashboards

Shared observability across 5-50 engineers. Cross-team trace aggregation. See what your entire engineering org is observing — not just your own laptop.

$100/month per team (5-user limit)

Persistent Storage — 90 Days

Retain traces for 90 days (vs. 14-day local storage on free tier). Export to Elasticsearch or S3 for long-term analysis. Audit trails for compliance teams.

Included in Team tier

On-Prem Deployment

Run the DevScope server on your own infrastructure. Air-gapped environments. Data residency compliance. Your telemetry stays in your data center.

Custom pricing

24/7 Support — 24-Hour Response

Slack and Teams integration. Dedicated support engineer. 24-hour response SLA. Priority bug fixes. Direct access to the engineering team that builds DevScope.

Included in Enterprise tier
Contact Sales for Enterprise Pricing

24-hour response SLA. Custom deployment. Volume discounts available.

Frequently Asked Questions

DevScope adds less than 50ms overhead via async instrumentation. The collector runs in a separate process. Your application threads are not blocked. Most developers do not notice any slowdown.

If you need even less overhead, disable auto-instrumentation and manually instrument only the code paths you care about.

View benchmark tests

Five minutes end-to-end. Install via CLI (1 minute). Run your app with devscope run (2 minutes). Open your dashboard at localhost:7878 (2 minutes).

Zero configuration required for Flask, FastAPI, Django, Express, Next.js, OpenAI, Anthropic, Redis, and Postgres. Manual instrumentation is available for other frameworks via the OpenTelemetry SDK.

View quick-start guide

Nowhere. All traces stay on your laptop. DevScope runs a local collector and dashboard. Zero external API calls. Zero cloud dependencies. Zero data exfiltration.

Your LLM prompts, API payloads, database queries, and trace data never leave your machine. There is no phone-home, no telemetry upload, no “anonymous usage data” sent to our servers. If you are offline, DevScope works exactly the same.

View privacy architecture

Yes. 100% offline-capable. No internet connection required. No VPN. No cloud login. DevScope runs entirely on your local machine.

Trace your code on an airplane. Debug in a coffee shop without Wi-Fi. Work in an air-gapped environment. DevScope does not need the network for any core functionality.

View offline mode documentation

Auto-instrumentation is available for:

Web Frameworks: Flask, FastAPI, Django, Express, Next.js

LLM Providers: OpenAI, Anthropic, Ollama, LangChain

Databases: PostgreSQL, MySQL, Redis, MongoDB

Infrastructure: Docker, Docker Compose

For frameworks not on this list, manual instrumentation is available via the OpenTelemetry SDK. DevScope is built on OpenTelemetry standards, so any OTel-compatible library works.

View full supported frameworks list

Yes. DevScope auto-instruments the OpenAI Python SDK, Anthropic Python SDK, Ollama, and LangChain. You see:

  • Prompts and responses (with optional redaction for sensitive content)
  • Cost per call (calculated from token usage and model pricing)
  • Latency (end-to-end request time, including network and model inference)
  • Token usage (prompt tokens, completion tokens, total)
  • Model metadata (model name, version, provider, temperature, max_tokens)

All data stays local. Your prompts are never sent to our servers or any third party.

View LLM observability guide

Still have questions? Join our community Slack.

Install Commands

Copy the command for your platform. One line. Zero config.

macOS

macOS 12+ (Monterey, Ventura, Sonoma, Sequoia). Apple Silicon (M1/M2/M3/M4) and Intel.

curl -sSL https://devscope.sh/install.sh | bash

Linux

Ubuntu 20.04+, Debian 11+, Fedora 36+, CentOS Stream 9+. x86_64 and ARM64.

curl -sSL https://devscope.sh/install.sh | bash

Windows (WSL2)

Windows 10/11 with WSL2 enabled. Ubuntu, Debian, or Fedora on WSL.

curl -sSL https://devscope.sh/install.sh | bash

Prefer to download the binary manually? View GitHub Releases — for air-gapped environments, custom installations, or package manager integration.

Start Observing Your Code Locally. Right Now.

Free forever. 5-minute setup. Privacy-first. Offline-capable.

macOS, Linux, Windows. No signup required. No credit card.

MIT License — Free Forever Open-source. Community-driven. No credit card. No signup. No vendor lock-in.